I’ve been working with Datadog’s Application Perfomance Monitoring recently and discovered that the APM agent produces both traces and metrics, which isn’t obvious from looking at the docs.
When the APM is configured, ie for ruby:
require 'ddtrace'
Datadog.configure do |c|
  # This will activate auto-instrumentation for Rails
  c.use :rails
end
Then the agent starts collecting various rails traces. Also, it collects related metrics (aka trace metrics).
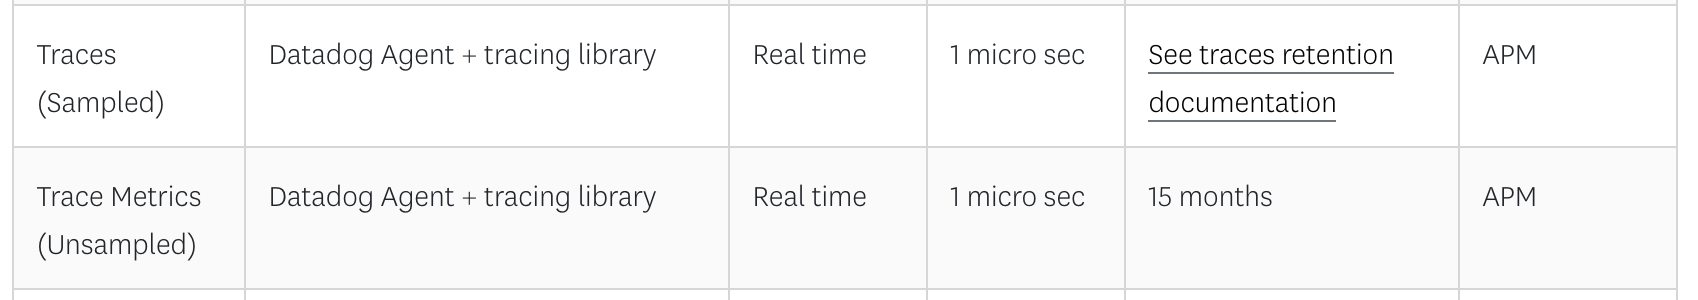
The differenece is important since 1) traces are sampled and metrics aren’t 2) traces provide much more information than metrics
Summary
- APM agent provides multiple adapters
- APM agent’s adapters provide multiple metrics along with traces.
- Traces are sampled: only subset of traces will be available for querying.
- Metrics are not sampled and are retained for 15mo
- Metrics are reliable source for Dashboards and Monitors; unlike traces since they’re sampled.
- Metrics are avilable under
trace.namespace and the pattern istrace.<adapter>.<resource>.*, so, for rails, it may look liketrace.rails.action_controller.hits
PS
DD touches on trace metrics but provides no additional information as to where/how it’s available:
Datadog APM computes following aggregate statistics over all the traces instrumented, regardless of sampling:
Total requests and requests per second
Total errors and errors per second
Latency
Breakdown of time spent by service/type
— https://docs.datadoghq.com/tracing/guide/trace_sampling_and_storage/?tab=nodejs#trace-sampling