At Rover.io we’re migrating existing rails/node monoliths into microservice based architecture. Recently we launched another Go powered, mongodb backed service which tracks device events.
This post is documents steps taken while debugging performance issues and using tests to detect and prevent performance degradation.
Why Mongo
Our service is backed by mongodb for few reasons:
- enable customer to have flexible schema for their data
- previous service was using mongodb and we aimed to minimize downtime during data migration
- have an ability to quickly query DB to address support issues
Performance issues
We’re tracking quite a bit of events: 
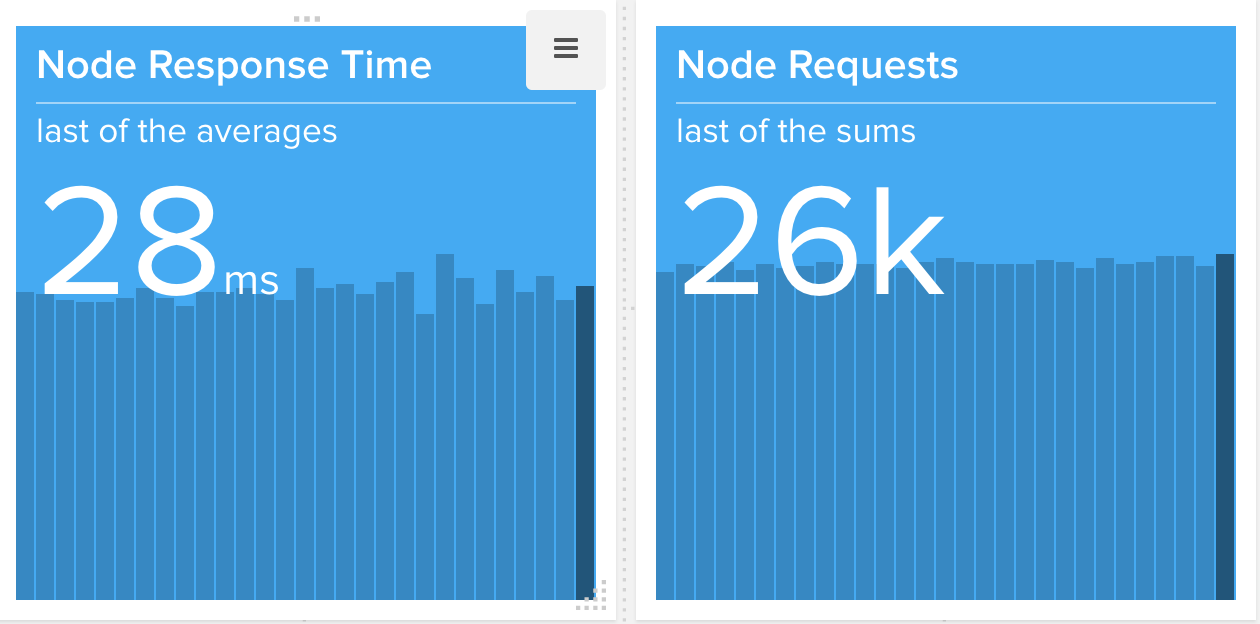
New gRPC interfaced services are gradually introduced into the existing system and the image shows a nodejs server request latency talking to a Go backend.
Last week another Go backed service went live and experienced few performance issues.
1. Single session use
The very first issue we ran into was the use of a single mgo session.
The services run in Kubernetes and the issue manifested itself as constsant service restarts(all the way into CrashloopBack pod state) due to mongodb pings timing out in a liveness probes.
Turns out single session use is a well known antipattern
so it was addressed by changing code to Copy master session for each gRPC call.
2. Unused indexes
The second issue we ran into was requests taking too long as seen on 
There was a query that wasn’t using index for some reason. There was a partial index for the query and it had additional options to only apply to a specific $types similar to this definition:
db.restaurants.createIndex(
   { a_field: 1  },
   { partialFilterExpression: { a_field: { $exists: true, $type: "string" }
)
Explaining queries
In order to understand why queries were taking too much time we used explain method.
explain() produces quite a bit of details but we only were interested in index related info.
COLLSCANs stages are slowest since they require complete collection traversal/scan to find queried data
also meaning that indexes aren’t being used and together with high docsExamined number it is an attribute of a slow query.
  "executionStages" : {
    "stage" : "COLLSCAN",
    ....
    "docsExamined" : 8851615
Hint-ing Mongodb to use an index
The first attempt to fix the issue was to use hint method:
db.coll.find({a_field: "value"}).hint({a_field: 1})
While explain showed no COLLSCANs it still did quite a bit of work examining too many keys:
"executionStages" : {
 "stage" : "IXSCAN",
 ...
 "keysExamined" : 3703493,
Hinting turned out to be not the most efficient solution in our case.
Explicit $type
Finally we ended up with a query that looked like:
db.coll.find({a_field: {$eq: "value", $type: "string"})
At last explain showed most efficient index use:
 "inputStage" : {
   "stage" : "IXSCAN",
   ...
   "keysExamined" : 1,
Finding slow queries
mongodb provides profiling to help find slow queries.
In order to enable profiling or run any administrative command one must have an admin account and connect to the db using mongo shell, for example like
mongo --ssl --sslAllowInvalidCertificates 'mongodb://user:pass@host:port/db_name?ssl=true&authSource=admin'
Another way to see what’s going on is to use db.currentOp command.
Finding slow queries with tests
All our tests are integration tests(which run against a dockerized mongodb instance) The tests run all the queries covering most use-cases which makes the test-suite perfect place for queries to be profiled and to detect ones that aren’t using indexes.
Our test setup looks like this:
var (
  // mdb is a *mgo.Database
  mdb = dialMongo(t, *tMongoDSN)
  system_profile   = mdb.C("system.profile")
)

profile := func(level int) {
  var res bson.M
  if err := mdb.Run(bson.M{"profile": level}, &res); err != nil {
    t.Fatal(err)
  }
}

profile(0) // turn off profiling to truncate collection
truncateColl(t, system_profile) // equivalent of mdb.DB("system.profile").DropCollection()
profile(2) // turn profiling for all queries
// ...


// fail if one of the queries ran wihout an index
t.Run("EnsureIndexes", func(t *testing.T) {
  var (
    res []bson.M
    // NOTE: system.profile records are version dependant
    // this query works for Mongo v3.4.4
    q = bson.M{
      // slow operations
      "op":          bson.M{"$in": []string{"query", "update", "remove"}},
      // find queries that do not use indexes
      "planSummary": bson.M{"$nin": []bson.RegEx{{Pattern: `IXSCAN`}, {Pattern: `IDHACK`}}},
      // ignore queries against system.profile
      "ns":          bson.M{"$nin": []bson.RegEx{{Pattern: `system.profile`}}},
    }
  )

  if err := system_profile.Find(Q).All(&res); err != nil {
    t.Error("system.profile:", err)
  }

    // nothing found
  if len(res) == 0 {
    return
  }

  // there are some slow queries
  // pretty print system.profile records
  data, err := json.MarshalIndent(res, " ", "  ")
  if err != nil {
    t.Errorf("unexpected:%v", err)
  }

  t.Errorf("non-optimized queries: %s", data)
})
test fails if there’s a query that doesn’t use an index.
Summary
- we learned how to debug and optimize mongodb queries
- we introduced query profiling in our tests to detect slow queries
Thank you.